
A per-service p99 describes one backend. Almost nobody sends a request to one backend. When a request fans out to a hundred of them it comes back at the speed of the slowest, and in my run backends that were each slow on one call in 100 made 63% of user requests slow, the figure Dean and Barroso give for the same setup.
Measure the user request, not the service: with 100 backends each slow on 1 call in 100, 63% of requests are slow when slow calls are independent. Alert on end-to-end latency, budget each backend at 1 in 10,000, never average percentiles, and load-test on a schedule.

The dashboard was never wrong about the service. It answered a different question from the one a user asks.
The request is a maximum
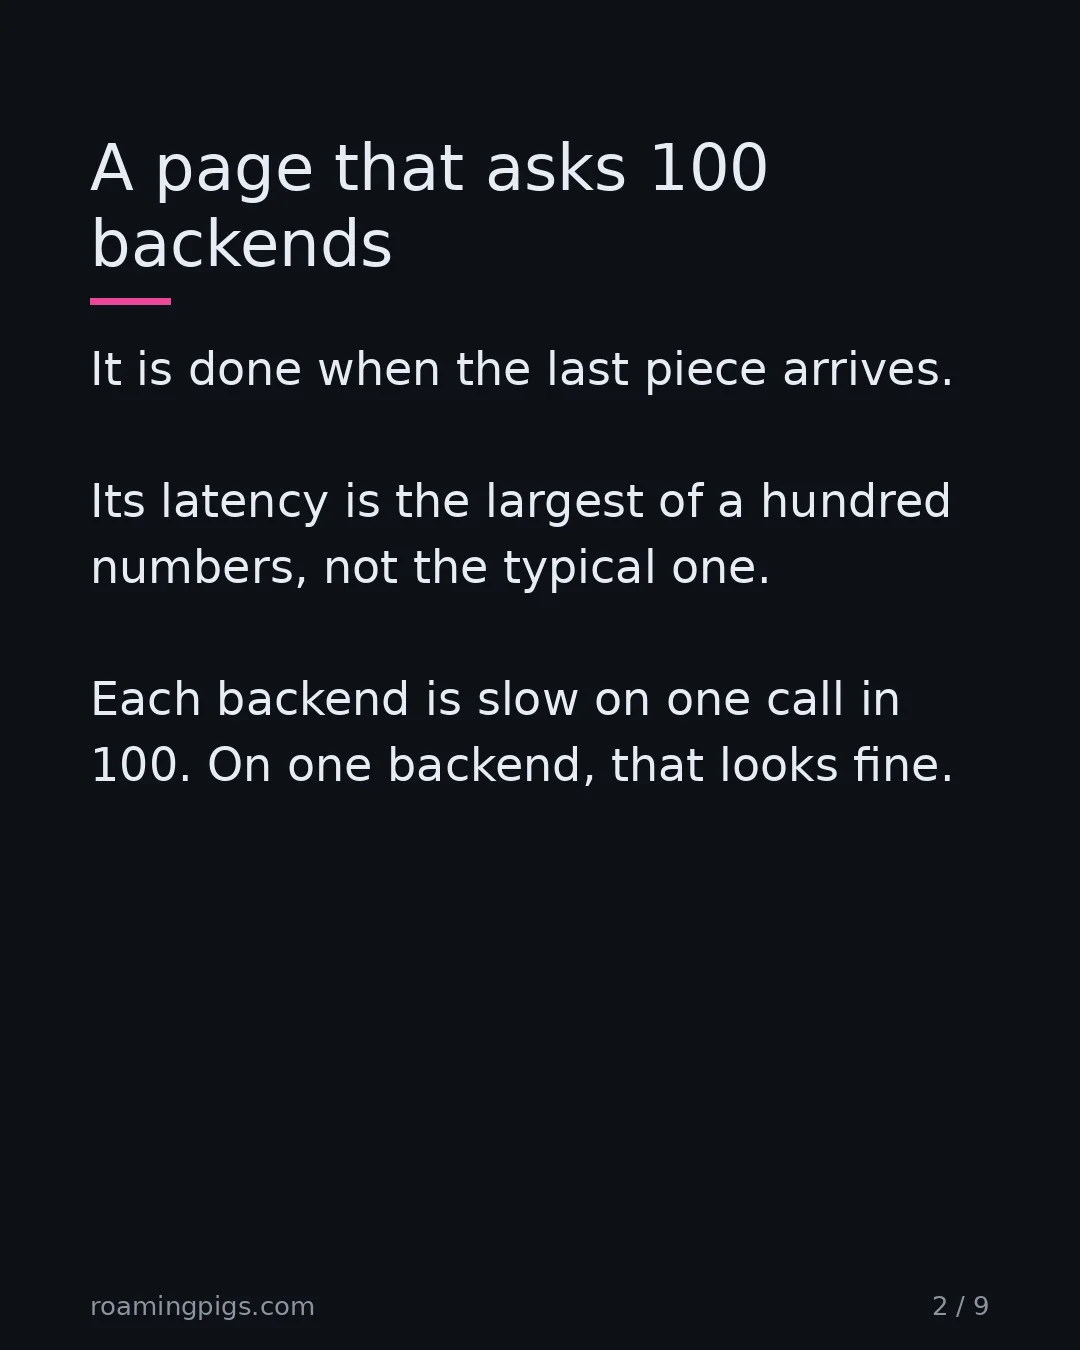
Take a page that asks a hundred backends for a piece each and waits for all of them. It is done when the last piece arrives. Its latency is the largest of a hundred numbers, not the typical one.
Dean and Barroso set this out in "The Tail at Scale" (Communications of the ACM, February 2013). Each server typically answers in 10 ms but has a 99th-percentile latency of one second. On one server, one request in 100 is slow. They write that if a user request must collect responses from 100 such servers in parallel, then 63% of user requests will take more than one second.
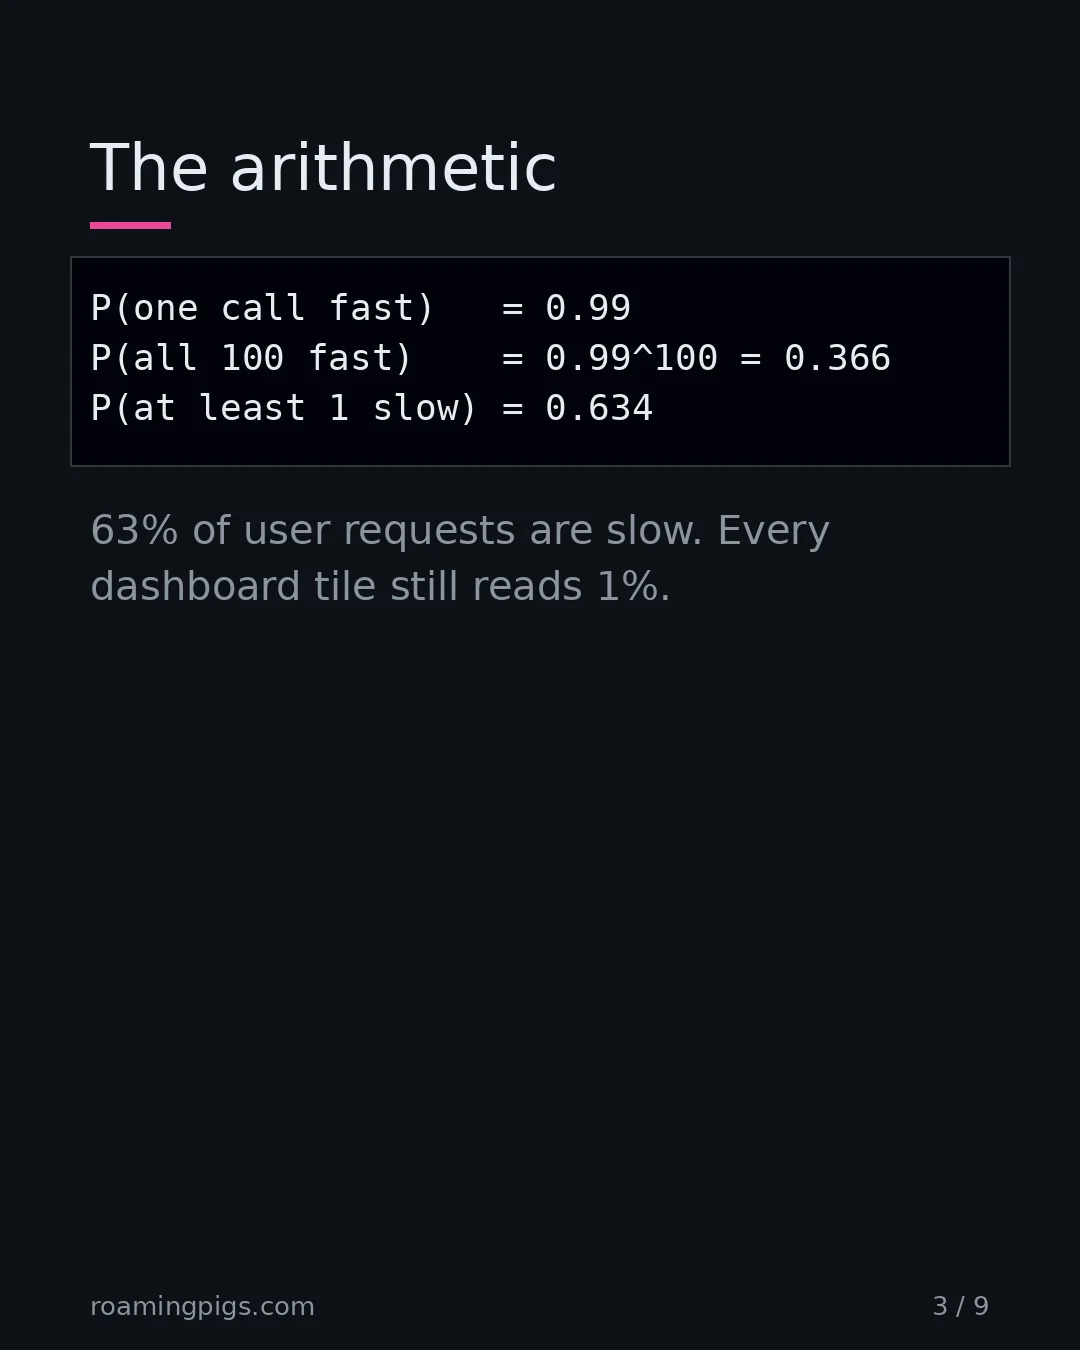
It fits on a napkin. One call is fast with probability 0.99. All 100 are fast with probability 0.99 to the power 100, which is 0.366. What remains, 0.634, is the chance that at least one call is slow.
The Google SRE book says the same thing from the other end. If your users depend on several slow-on-occasion web services to render their page, "the 99th percentile of one backend can easily become the median response of your frontend."
What I ran
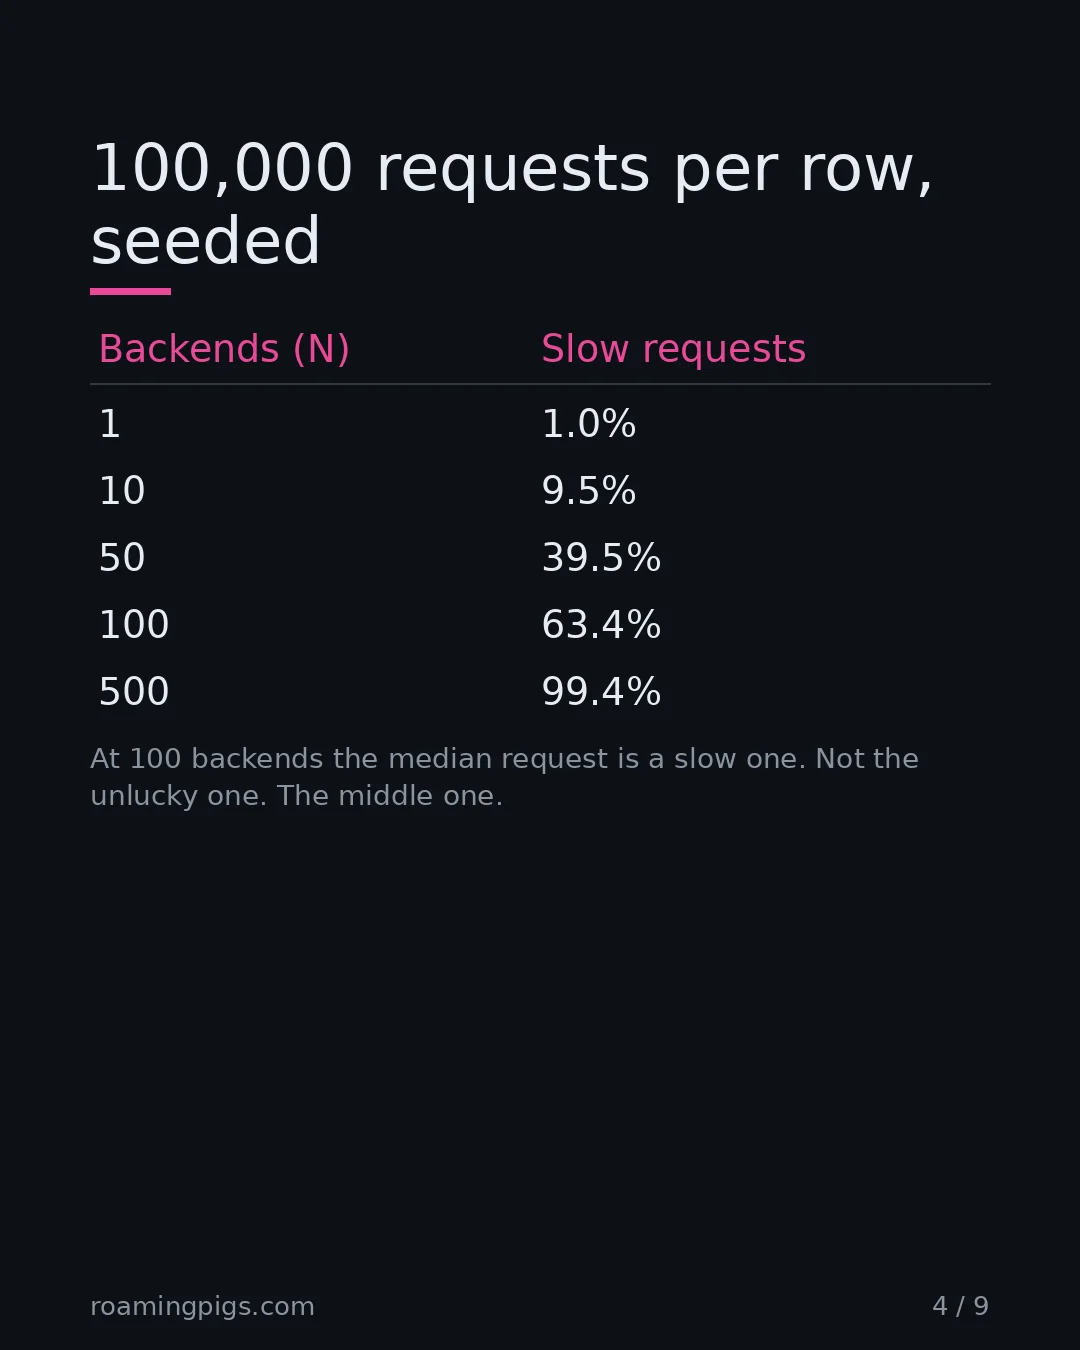
I did not want to repeat a figure from a paper without trying it, so I wrote a fan-out simulation. Each backend call takes about 10 ms and is slow, about a second, with a probability I set. A user request makes N calls in parallel and takes the maximum. I ran 100,000 user requests per row, seeded, with no network involved. The setup is small enough to rebuild in an afternoon. A request counts as slow at 500 ms or more.
| Backends per request (N) | Formula, 1 - 0.99N | Simulated slow requests | Median request (ms) |
|---|---|---|---|
| 1 | 1.0% | 1.0% | 10.0 |
| 10 | 9.6% | 9.5% | 16.0 |
| 50 | 39.5% | 39.5% | 22.2 |
| 100 | 63.4% | 63.4% | 950.9 |
| 500 | 99.3% | 99.4% | 1115.0 |
Look at the last column. At 100 backends the median request is a slow one. Not the unlucky one in a hundred. The middle one.
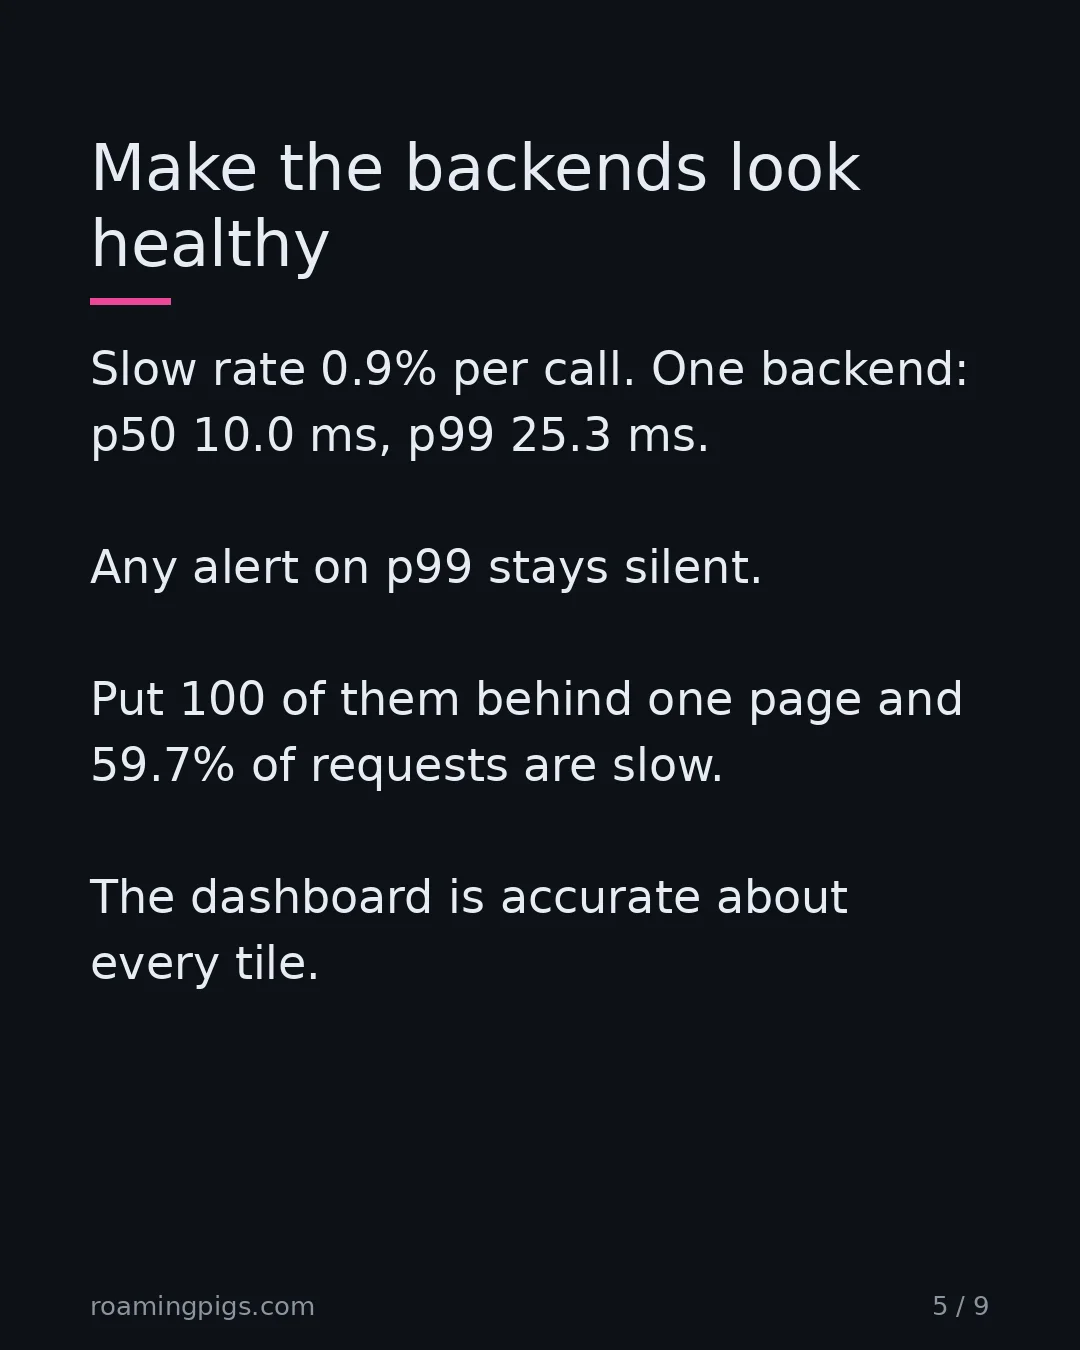
Now make the backends look healthy. Lower the slow rate to 0.9% per call and read one backend's own numbers: p50 10.0 ms, p99 25.3 ms, p99.9 1,132 ms. Any alert set on p99 stays silent. Put 100 of those backends behind one page and 59.7% of simulated requests are slow, against 59.5% from the formula. A dashboard of green tiles can sit on top of that and be accurate about every tile.
Per-service percentiles are not useless. Once a request is slow, they tell you which backend to go and fix. They just cannot tell you how many users that backend has already hurt.
The same gap shows up in the paper's measurements of a real Google service. The 99th-percentile latency for a single sub-request to finish was 10 ms. For all of them to finish it was 140 ms.
The formula is a ceiling, not a reading
My first draft of the rule was "compute 1 - (1 - p)N and read the request tail off it." I tried to break that before keeping it, and it broke.
The formula assumes the slow calls are independent. Real slow calls often are not. A shared database takes a lock, a shared queue backs up, a deploy restarts the same cache that every backend reads. When that happens, one event slows many calls in the same request at once, and they overlap instead of adding up.
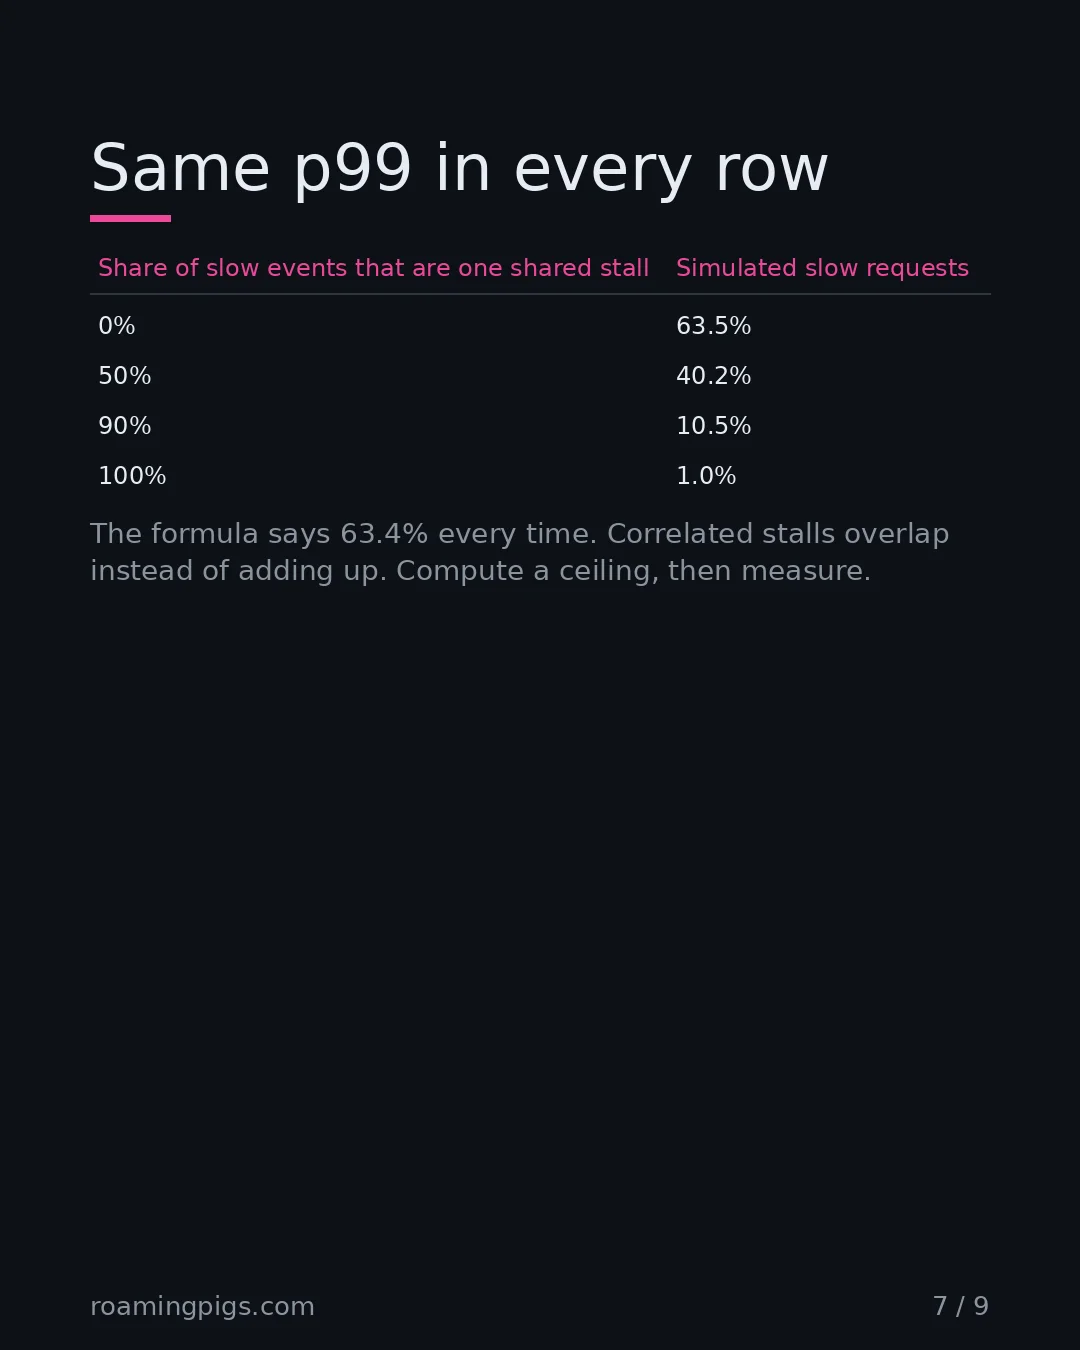
So I added a shared stall to the simulation. A fraction of the slow events hit every backend at the same moment. I held each backend's own slow rate at 1%, so each service's dashboard looks identical in every row.
| Share of slow events that are one shared stall | Formula says | Simulated slow requests |
|---|---|---|
| 0% | 63.4% | 63.5% |
| 50% | 63.4% | 40.2% |
| 90% | 63.4% | 10.5% |
| 100% | 63.4% | 1.0% |
Same per-backend p99 in every row. Request tail anywhere from 1% to 63%. That is the result that matters, because it means no calculation from per-service numbers can give you the user's experience. The formula is exact when slow calls are independent and it overstates when they share a cause. It is a ceiling you can use to size an alarm. It is not a measurement.
Hedging, which means sending the same call to a second replica and taking whichever answers first, has the same limit. The paper reports that in a benchmark reading 1,000 keys spread over 100 servers, sending a second request after 10 ms cut the 99.9th-percentile time to fetch all of them from 1,800 ms to 74 ms, for 2% more requests. In my idealised version, where the second call goes out at once, hedging took 100 independent backends from 63.6% slow requests to 1.0%. With half the slow events shared it went from 39.8% to 0.75%. With all of them shared it did nothing, 1.0% before and after. A second replica cannot help when both replicas wait on the same thing.
A request is only as well measured as its hundred calls, so the two habits below hurt more under fan-out, not less.
Two ways the measurement lies
Even if you agree to measure the request, two habits corrupt the number before you read it.
Averaging percentiles across hosts. A percentile is not additive. I made up two cases and compared the mean of the per-host p99s with the p99 of all the requests pooled together.
| Hosts | Mean of per-host p99 (ms) | Pooled p99 (ms) |
|---|---|---|
| Nine hosts with 100,000 requests each at 0.1% slow, one host with 20 requests, all slow | 135.8 | 20.4 |
| Two hosts with 100,000 requests each, one at 10% slow and one at 0.1% | 577.4 | 1,088.2 |
The mean was too high in one case and too low in the other. What adds correctly is a count: calls over the threshold, and calls in total.
A load generator that waits. If your test sends the next request only after the last one returns, then a long stall holds back all the requests that would have arrived during it, and none of them is ever timed. The HdrHistogram documentation gives the picture. Sample once every 10 ms. The system answers in 1 ms for 100 seconds, 10,000 samples, then pauses for 100 seconds and records one sample. The raw samples put about 99.99% of results at 1 ms or below. Corrected for the samples the pause swallowed, only about 50% are.
I ran my own small version. Target 1,000 requests a second for 100 seconds, 0.5 ms per request, one 2-second stall at the 30-second mark. Timed from when each request should have been sent, the 99th percentile was 1,500.5 ms and the 99.9th was 1,950.5 ms. With one request in flight at a time, timed from when it was actually sent, both were 0.5 ms. The slow case appeared once, as a maximum of 2,000.5 ms, in 100,000 samples. Same server, same stall. Fan that out to a hundred backends and the request-level tail built on those numbers is wrong at every leaf.
What to put on the dashboard instead
The rule that survived is shorter than the one I started with.
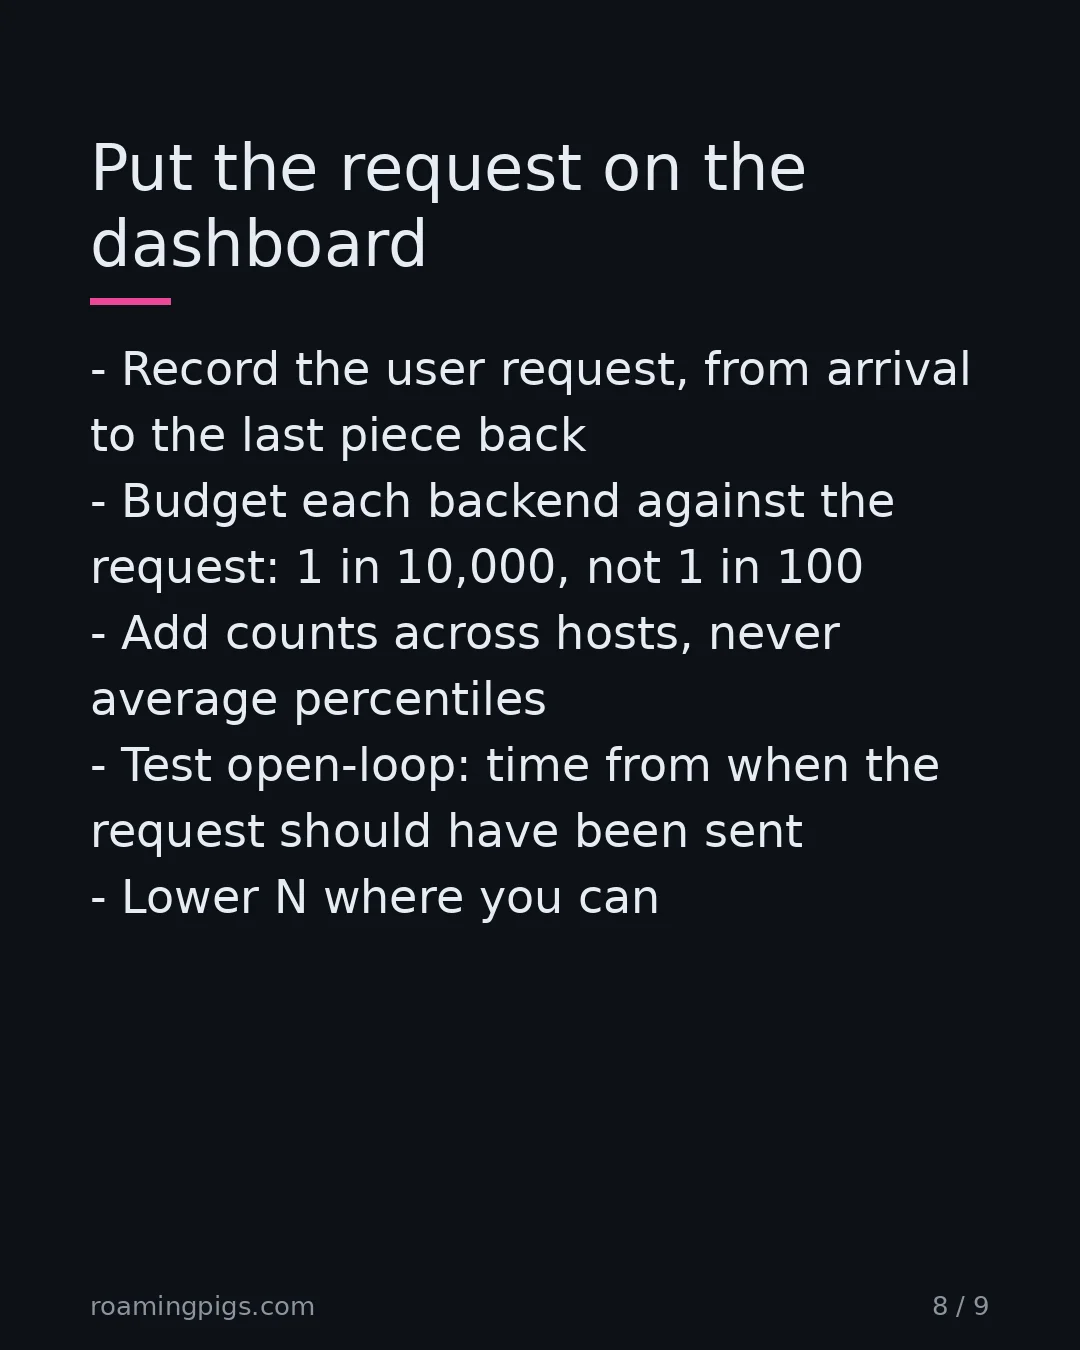
Record the user request itself, from when it arrives to when the last piece returns. That is the number a person experiences. If you cannot yet, put the formula next to your per-service p99 as a ceiling, and treat the real figure as somewhere between the single-service rate and that ceiling.
Budget each backend against the request, not against itself. If a fan-out of N may be slow on 1% of requests, and slow calls are independent, each backend may be slow on about 1 call in 100 times N. For 100 backends that is 1 in 10,000, and I confirmed it: a per-backend slow rate of 0.0100% gave 1.01% slow requests in the simulation. The two functions below do that and the open-loop timing.
def per_backend_budget(request_slow_budget, n):
    """Largest per-backend slow fraction that keeps a fan-out of n
    inside the request-level budget, if slow calls are independent."""
    return 1 - (1 - request_slow_budget) ** (1 / n)


def latency_from_intended(intended_send, finished):
    """Charge a late send to the system, not to the load generator."""
    return finished - intended_send


per_backend_budget(0.01, 100)      # 0.0001005, about 1 call in 10,000
A 1-in-10,000 rate also needs enough calls to see it. Ten thousand calls in a window gives you one slow call in expectation, which is not a p99.99, it is an anecdote. Count slow calls over a threshold and add the counts across hosts. Do not average percentiles. And test open-loop: send on the schedule and time from the schedule.
Where you can, lower N. The cheapest call to make slow-proof is the one that never leaves the process, the case the SQLite article makes for queries. Every service you split out is another draw, on top of the network cost per call. The same multiplication that sinks long agent chains, 95% per step becoming about 8% over fifty, is the one working here on speed instead of success.
What this does not cover
I tested parallel fan-out where the request waits for all N. I did not test sequential chains, where latencies add instead of taking a maximum. I did not test retries or timeouts, partial results returned at a deadline, or load that makes one request's slowness cause another's, because my simulated requests are independent of each other. One shared stall is a crude model of correlation. Real systems have many partial ones, which is why the answer is to measure rather than to compute a better formula.
Before You Trust a Latency Dashboard
Five changes, starting with where you measure.
- Record the user request where it enters, from arrival to the last piece returning. Keep per-service p99 for finding the backend at fault.
- Budget each backend against the request: 1 - (1 - request budget)^(1/N). A 1% request budget across 100 backends leaves each about 1 slow call in 10,000.
- Count calls over a threshold and calls in total, and add the counts across hosts. Do not average percentiles.
- Measure whether slow calls share a cause before you rely on hedging or the formula. When every slow event was shared, hedging did nothing.
- Run load generators open loop. Send on the schedule and time each request from when it should have been sent.
The Bottom Line
Keep the per-service p99 to find the backend at fault, and stop reading it as what a user got. The user got the worst of every call in the request. Whether that is 1% slow or 63% slow depends on whether the slow calls share a cause, and no per-service number says which. Record the request, and keep the formula as your ceiling.
"A per-service p99 is a statement about one backend. Nobody sends a request to one backend."
Sources
- The Tail at Scale — Jeffrey Dean and Luiz Andre Barroso, Communications of the ACM, vol. 56 no. 2, February 2013, pages 74-80. Source for the 63% of requests above one second across 100 servers (99th percentile one second, typical 10 ms), almost one in five at 2,000 servers with 1 in 10,000 slow, the real-service table (10 ms vs 140 ms) and the hedged-request benchmark (1,800 ms to 74 ms, 2% more requests).
- Monitoring Distributed Systems — Rob Ewaschuk (Site Reliability Engineering, O'Reilly; page footer Copyright 2017 Google). Source for the line that the 99th percentile of one backend can easily become the median response of your frontend.
- HdrHistogram README: corrected vs raw value recording — HdrHistogram project README (first committed 2014-06-26). Source for the coordinated-omission illustration: 10 ms sampling, 10,000 samples at 1 ms then a 100-second pause with one sample, about 99.99% at 1 ms raw against about 50% corrected.

Disagree? Have a War Story?
I read every reply. If you've seen this pattern play out differently, or have a counter-example that breaks my argument, I want to hear it.
Send a Reply →