
A profit number a company invented is only as honest as its bridge back to the GAAP number. In the We Company's 2019 S-1, that bridge turns a $1.37 billion half-year operating loss into a $141.8 million contribution margin. Five of its lines come back period after period.
For any adjusted metric, find the bridge to the GAAP number, mark each add-back cash or non-cash, and flag any cash add-back present in three periods under any name. In the We Company's S-1, five operating lines of $1,416.0 million bridged a $1.37 billion half-year loss to a $141.8 million margin.

Start with the arithmetic
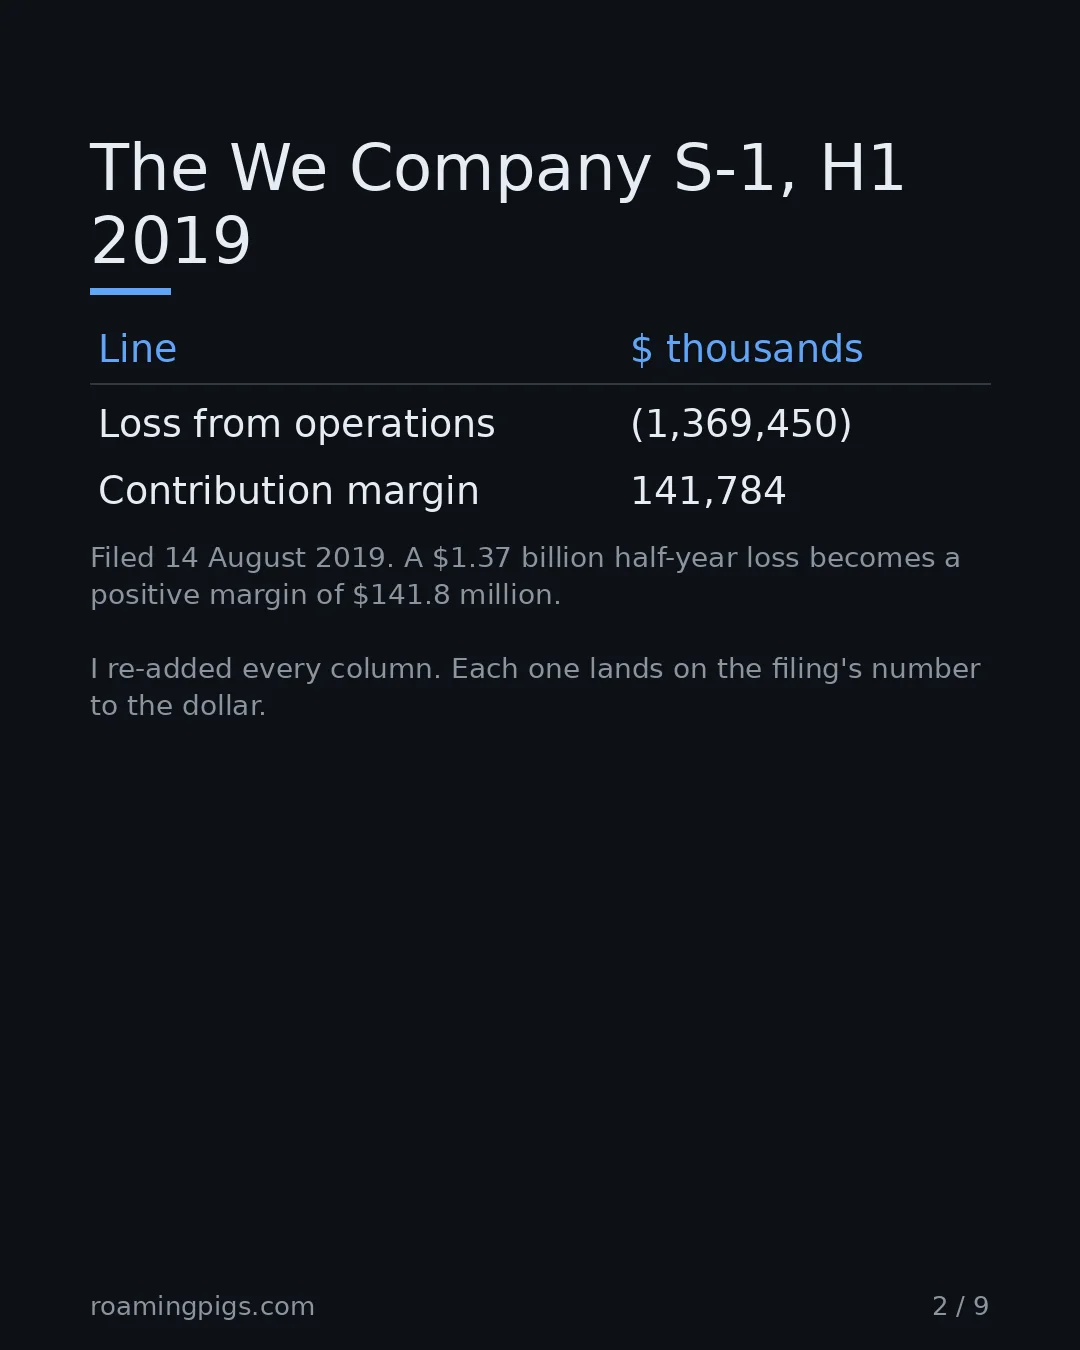
The We Company filed its S-1 with the SEC on 14 August 2019. In its discussion of the metrics it tracks, it defines contribution margin as "membership and service revenue less location operating expenses (both as determined and reported in accordance with GAAP), adjusted to exclude non-cash stock-based compensation expense included in location operating expenses." That is the name the filing uses. Then it reconciles the measure to loss from operations, the GAAP figure closest to it. Here is that reconciliation for the six months ended 30 June 2019, with a running total I added. The statements are the filing's unaudited interim ones, and the amounts are in thousands of dollars.
| Step | Filing | Running total |
|---|---|---|
| Loss from operations | (1,369,450) | (1,369,450) |
| Less: other revenue | (186,648) | (1,556,098) |
| Add: other operating expenses | 81,189 | (1,474,909) |
| Add: pre-opening location expenses | 255,133 | (1,219,776) |
| Add: sales and marketing | 320,046 | (899,730) |
| Add: growth and new market development | 369,727 | (530,003) |
| Add: general and administrative | 389,910 | (140,093) |
| Add: depreciation and amortization | 255,924 | 115,831 |
| Add: stock compensation in location expenses | 25,953 | 141,784 |
| Contribution margin including non-cash GAAP straight-line lease cost | 141,784 |
I re-added every column of the filing's table, and each one lands on the filing's number to the dollar. The order of my running total is mine. The total crosses zero at depreciation only because I put depreciation there. Shuffle the rows and the crossing moves. The sum does not.
Five lines, period after period
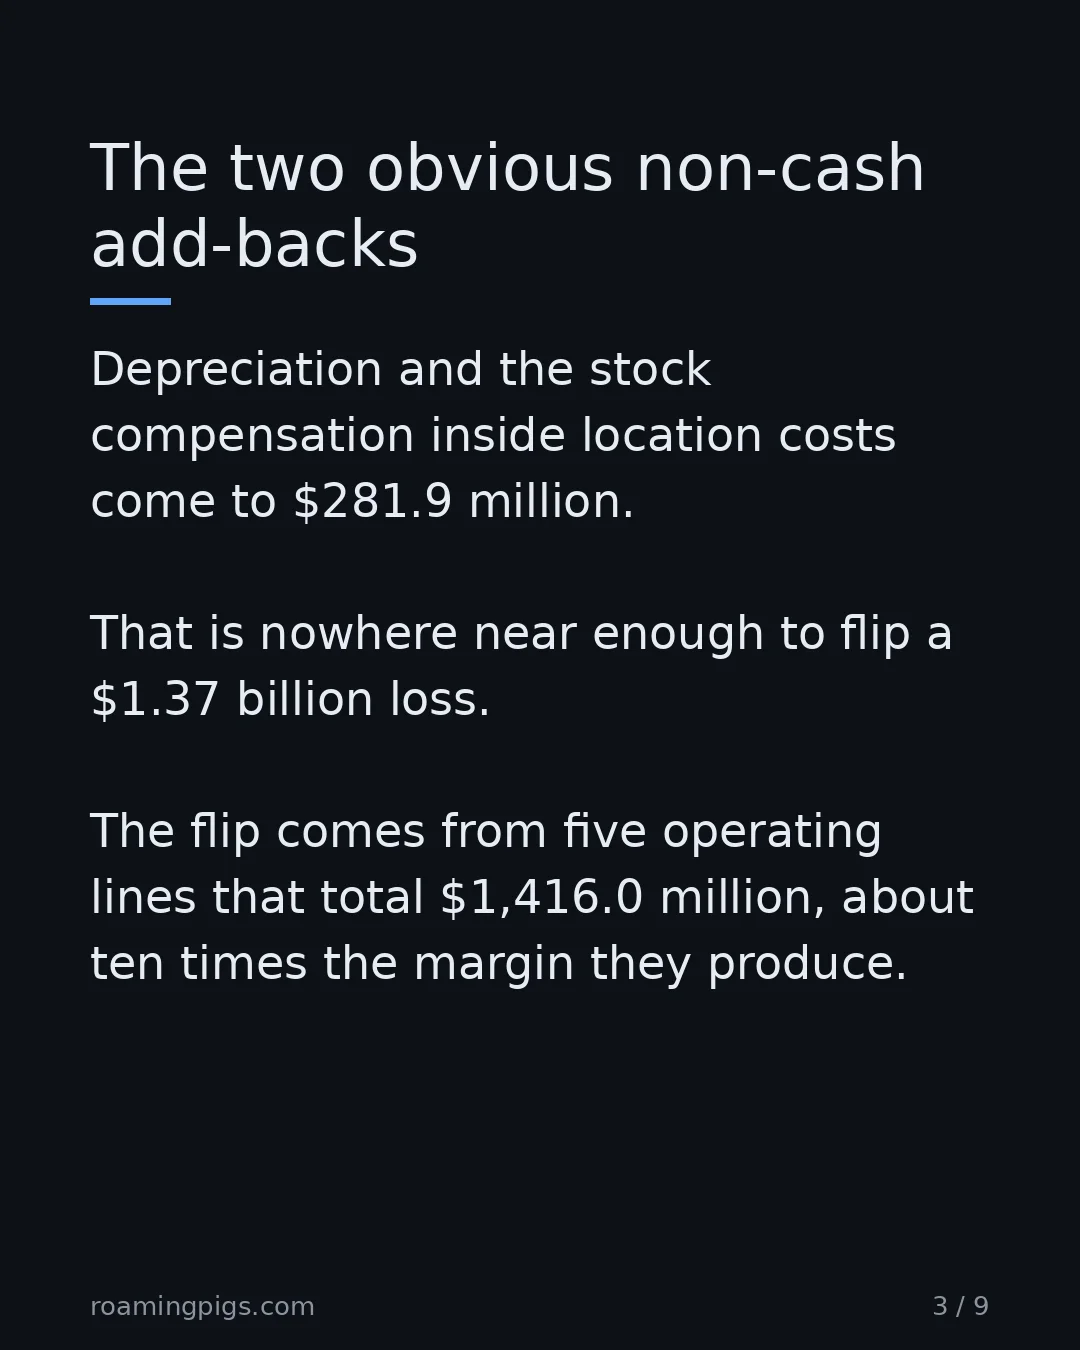
Take away the two obviously non-cash add-backs, depreciation and the stock compensation inside location costs. That is $281.9 million. It is nowhere near enough to flip a $1.37 billion loss. The flip comes from five operating lines that total $1,416.0 million, about ten times the margin they produce.
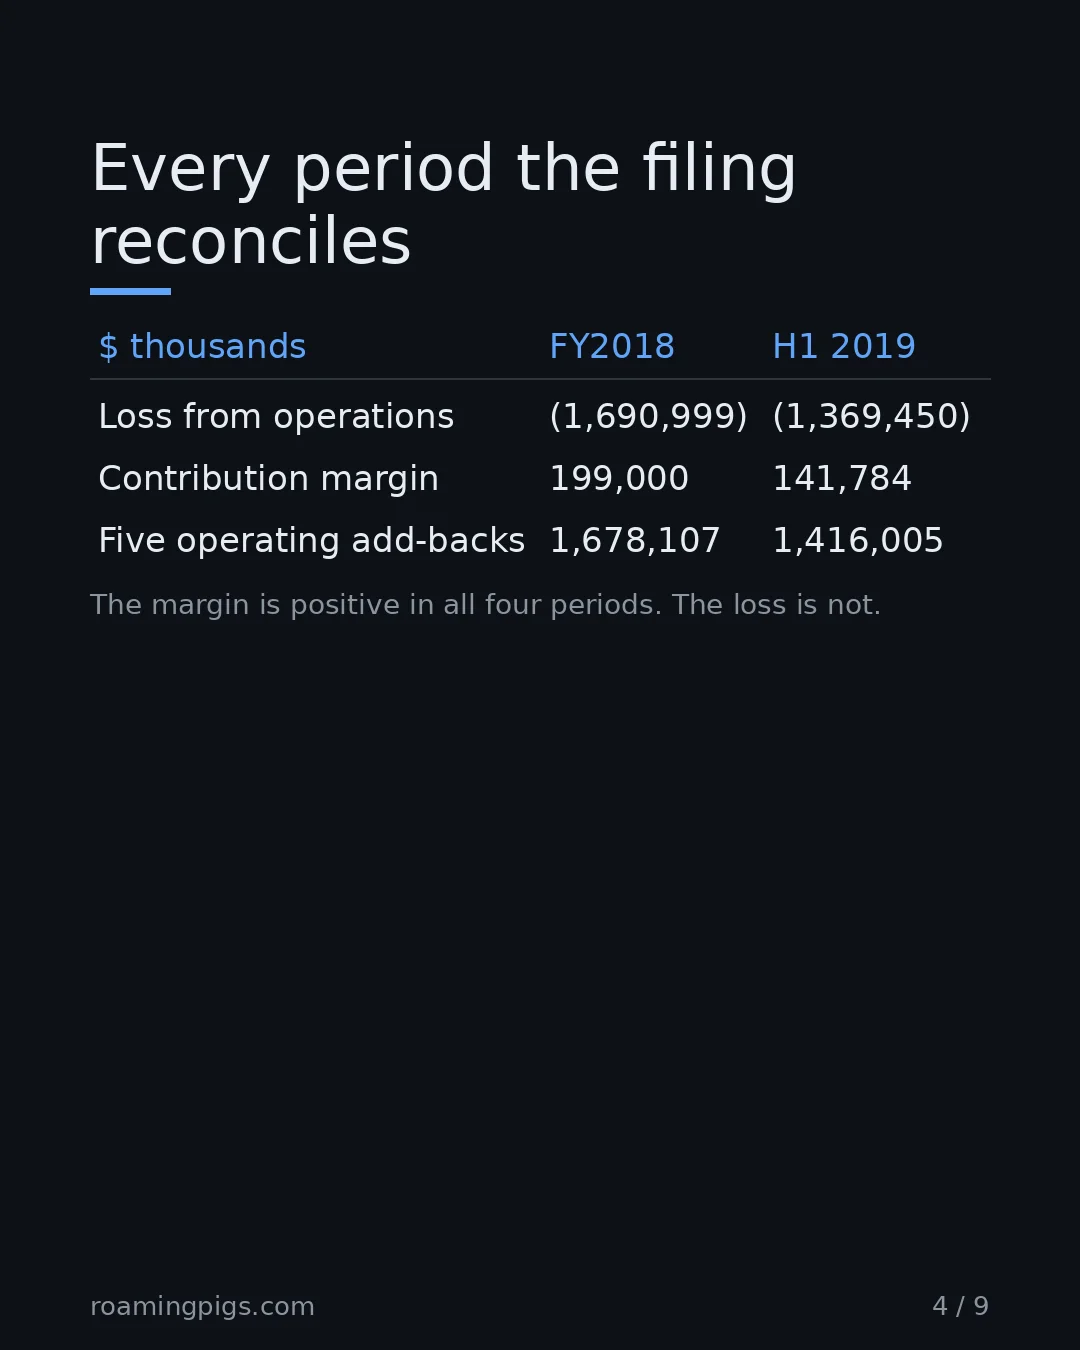
Those five did not show up for one bad half-year. Here they are across every period the filing reconciles.
| $ thousands | FY2016 | FY2017 | FY2018 | H1 2019 |
|---|---|---|---|---|
| Loss from operations | (396,274) | (931,834) | (1,690,999) | (1,369,450) |
| Contribution margin | 3,220 | 70,834 | 199,000 | 141,784 |
| The five operating add-backs | 310,254 | 840,164 | 1,678,107 | 1,416,005 |
Four of the five have a nonzero amount in every column. The fifth, other operating expenses, is blank for 2016 and present in the three that follow. The margin is positive in all four periods. The loss is not.
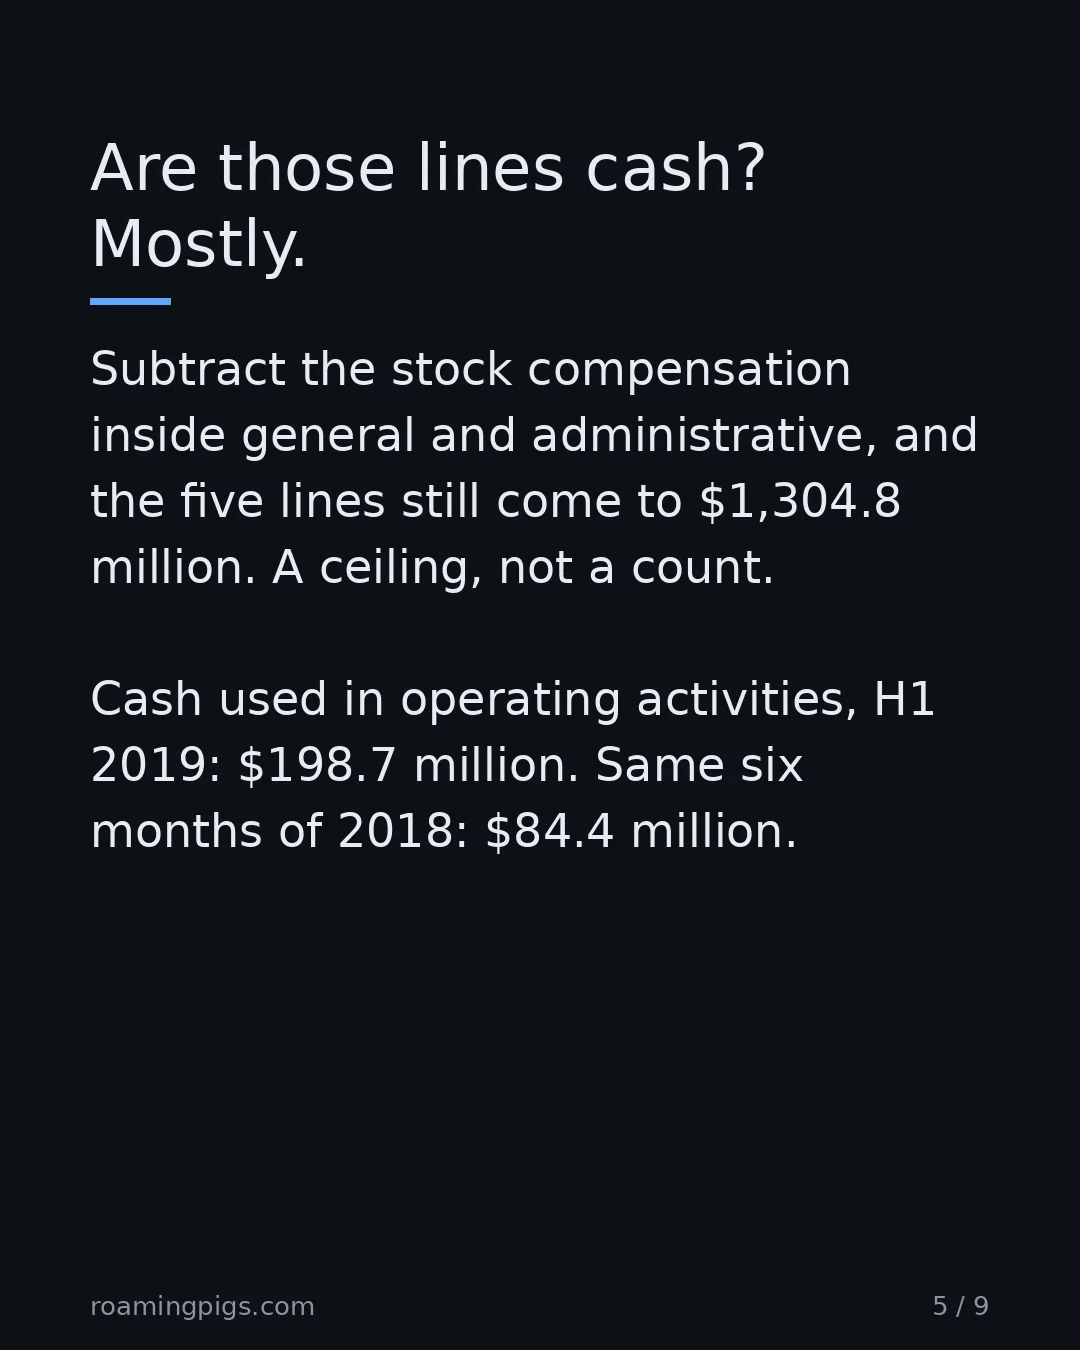
Are the five lines cash? Mostly, but the filing does not let me say all. It tells you that general and administrative expense for the half includes $111.2 million of stock compensation. Pre-opening location expenses include straight-line lease cost, which the filing calls non-cash, and the reconciliation does not say how much of it sits in that line. Subtract the stock compensation and the five lines still come to $1,304.8 million. Read that as a ceiling on recurring cash costs, not a count.
The same filing's statement of cash flows says the company used $198.7 million of cash in operating activities in those six months. In the same six months of 2018 it used $84.4 million. That figure carries interest and working capital, so it does not prove where the money went. It does sit in the same document as a positive margin, and it is worth reading both.
There is a measure that starts from cash and so skips most of this argument. A burn multiple is net burn divided by net new annual recurring revenue, and the fintech winter thaw shows how to work one out. Its inputs have their own definitions to check, but nobody has to add anything back to reach it.
The filing's case
The logic is sound for the question it asks, and the company does not hide the bridge. It explains each add-back. General and administrative costs, it says, "are not incurred at the location level and are therefore not directly attributable to the operation of our locations." Pre-opening costs come before a location opens. A location-level margin asks a fair question: once a building is open and full, does it earn more than it costs to run?
The filing also says what the number is not. Of these measures it says "these measures are not an indicator of our performance as a whole and do not include all expenses necessary to operate our business." And it adds that "Contribution margin is not a measure of, nor does it imply, profitability under GAAP."
So nothing here is concealed. My point is narrower. The warning sits in the table and the notes. A metric on a slide, in a board pack or in a headline has no notes. Whoever reads "margin" there is not told it leaves out the costs of selling, administering and growing the company. That is why the habit has to be the reader's. I wrote about the slide version of this in startup metrics theater. The boardroom version, where a board nods along to a deck it cannot question, is in why your board does not understand technology.
What the SEC says, and what I am not saying
The rules want the bridge. Regulation G, which the SEC adopted in a release published in the Federal Register on 30 January 2003, requires a company that publicly discloses a non-GAAP measure to present "A reconciliation ... of the differences between the non-GAAP financial measure disclosed or released with the most comparable financial measure or measures calculated and presented in accordance with GAAP identified in paragraph (a)(1) of this section." The same release amended Item 10 of Regulation S-K, which covers filings like an S-1. Item 10(e) bars a company from adjusting a performance measure "to eliminate or smooth items identified as non-recurring, infrequent or unusual" when the charge is reasonably likely to recur within two years, or a similar one came in the prior two years.
The staff's current view is in its Compliance and Disclosure Interpretations, question 100.01, last updated 13 December 2022. It says "Presenting a non-GAAP performance measure that excludes normal, recurring, cash operating expenses necessary to operate a registrant's business is one example of a measure that could be misleading," and that the staff views an expense that "occurs repeatedly or occasionally, including at irregular intervals" as recurring. It also says the answer depends on a company's facts and circumstances.
That wording is more than three years younger than the S-1, and the filing never calls any of these lines non-recurring. Nothing here says the SEC objected to this filing, and I have seen nothing to suggest it did. I am using the SEC's published test as a reading tool, and the table is what it reads.
My first rule failed on two tables
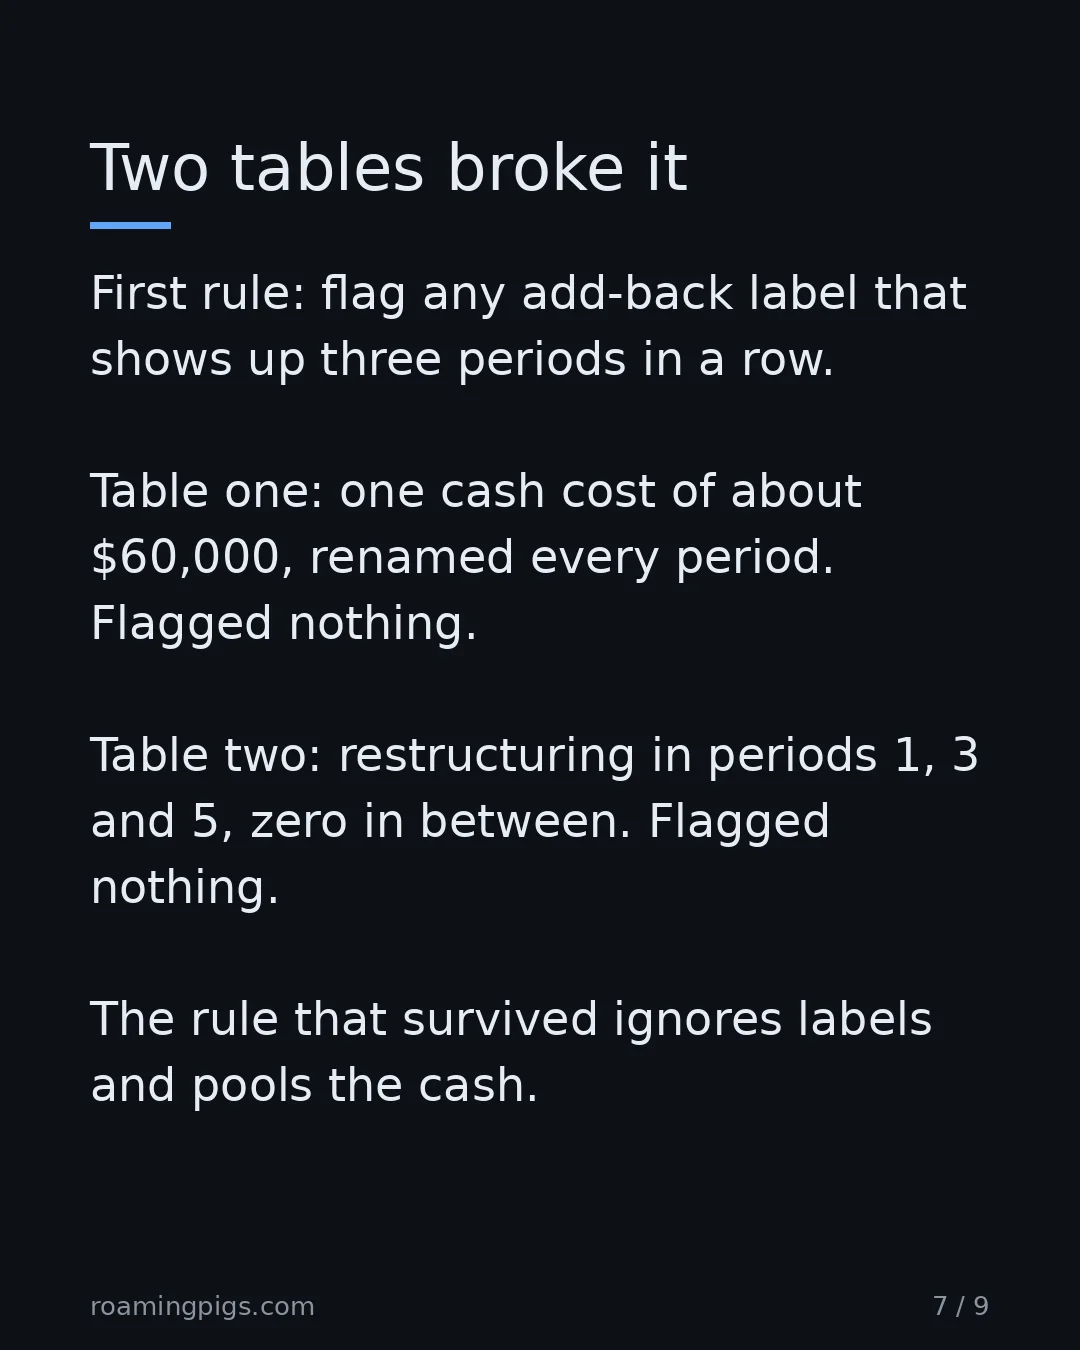
My first reading procedure was simple. List the add-backs, and flag any label that shows up in three periods in a row. I wrote tables to break it, and it broke twice.
In the first, a made-up table, one cash cost of about $60,000 a period gets a new name every period: restructuring, transformation, one-time program, business optimization, special initiative. Each label appears once. The label rule flagged nothing. In the second, a single label, restructuring, appears in periods 1, 3 and 5 and is zero in between. It is never consecutive. The label rule flagged nothing there either.
The version that survived ignores labels. It keeps only the cash part of each add-back. A line is recurring if it is positive in any three periods. Every cash add-back that does not recur under its own name goes into a pool. If the pool is positive in three periods, it is the same cost under different names.
MIN = 3  # periods

def flag_recurring_cash(rows):
    """rows: {label: (amount_per_period, noncash_per_period)}"""
    cash = {k: [a - n for a, n in zip(*v)] for k, v in rows.items()}
    recurring = [k for k, c in cash.items() if sum(x > 0 for x in c) >= MIN]
    odd = [c for k, c in cash.items() if k not in recurring and any(x > 0 for x in c)]
    pool = [sum(col) for col in zip(*odd)] if odd else []
    return recurring, sum(x > 0 for x in pool) >= MIN
I ran it on seven tables, one real and six made up. On the S-1's bridge it flags all five operating lines, and the flagged cash is at most 95.3 percent of the half-year loss. On a made-up table for a healthy company, with one $50 million cash restructuring and one $40 million non-cash impairment, it flags nothing. A real two-period program is not flagged. The renamed cost and the alternating cost are both flagged.
Two tables beat it. If the recurring cost is capitalised, it never reaches the income statement, the bridge is clean, and the rule has nothing to read. And a company that really does buy a business most years has deal costs in the bridge in most periods. The rule flags that honest company. By the SEC's wording those costs are recurring, but whether the measure is misleading is a judgment about that company. The rule does not make it.
That is the limit. The rule is a screen. It tells you where to ask a question, and it cannot tell you what the answer is.
Before You Trust an Adjusted Number
Five steps, in order. The first one is the one people skip.
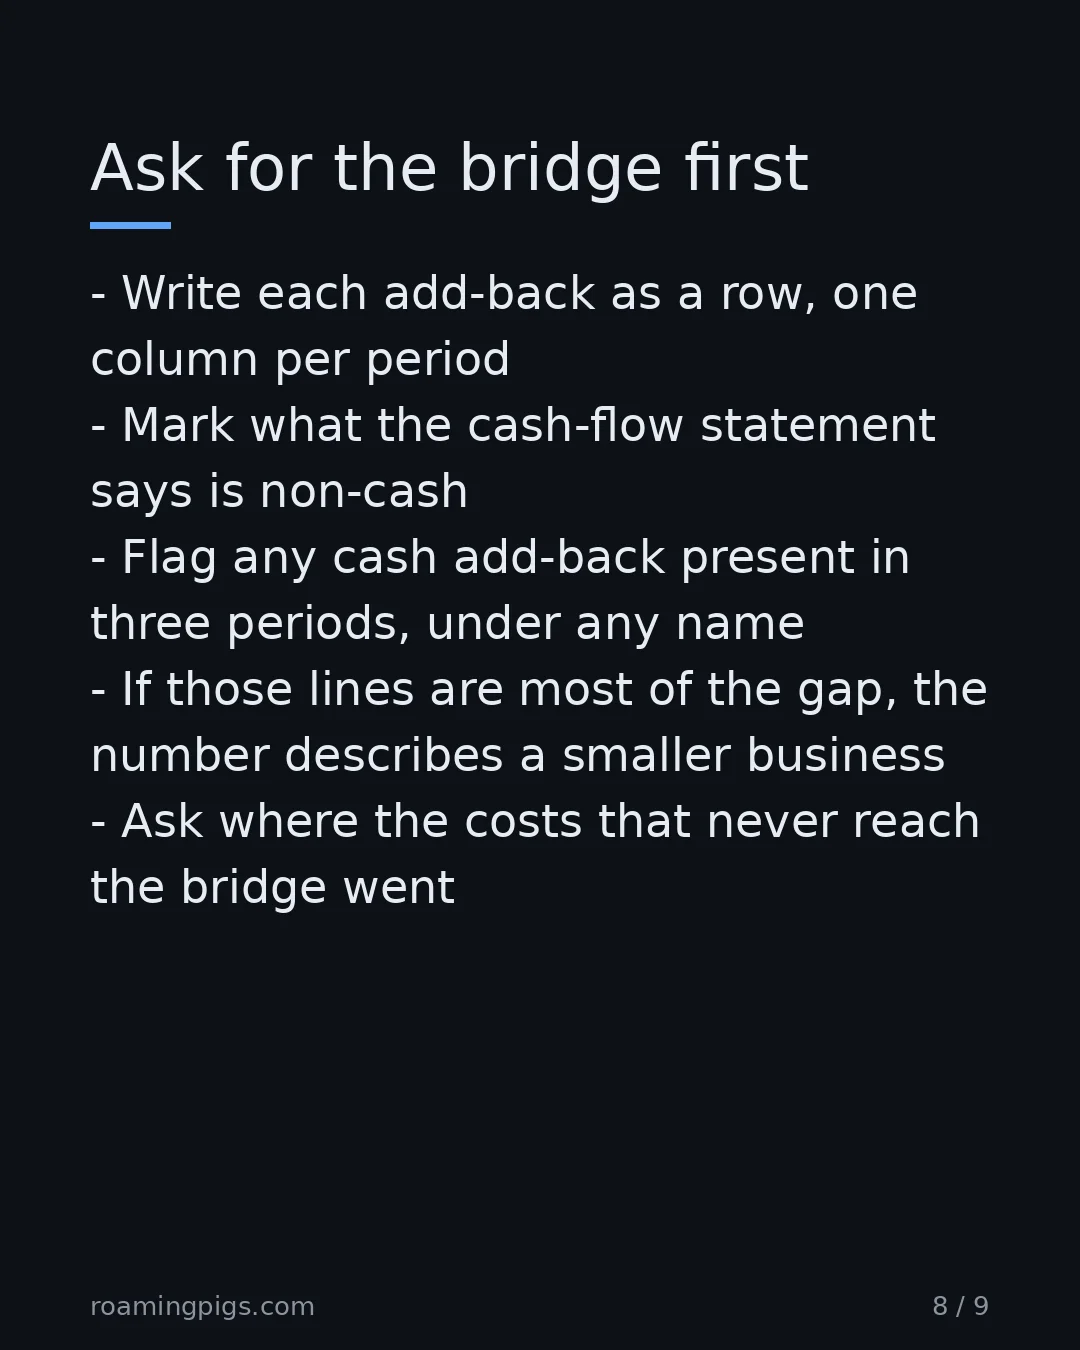
- Ask for the bridge from the adjusted number to the GAAP number. If there is no bridge, there is no number.
- Put each add-back on its own row and give every period you can get its own column. Three periods is the minimum.
- Mark each add-back cash or non-cash using the cash-flow statement, not the add-back's own label.
- Flag any cash add-back that is nonzero in three periods, under any name, and pool the differently named one-offs before you decide they are one-offs.
- Compare the flagged total with the gap to GAAP. Then ask where any recurring cost that never reaches the bridge went.
The Bottom Line
A metric is its reconciliation. The name is just the label on the front. When someone shows you an adjusted number, ask for the bridge to the GAAP number first. Write each add-back as a row, with a column for every period you can get, and mark what the cash-flow statement says is non-cash. Then flag any cash add-back that shows up in three periods, under any name. If those lines are most of the gap, the number describes a smaller business than the one you are buying, joining or funding. Ask what they cost, and ask where the costs that never reach the bridge went.
"A metric is its reconciliation. The name is just the label on the front."
Sources
- The We Company, Form S-1 registration statement — Reconciliation of loss from operations to contribution margin; definitions and limitations of the measure; interim statements of operations and cash flows (unaudited), six months ended 30 June 2019.
- SEC Division of Corporation Finance, Non-GAAP Financial Measures Compliance and Disclosure Interpretations — Question 100.01 on adjustments that can make a non-GAAP measure misleading; staff view of recurring expenses.
- Conditions for Use of Non-GAAP Financial Measures (Federal Register final rule, 68 FR 4819) — Final rule adopting Regulation G and amending Item 10 of Regulation S-K; published 30 January 2003.
- 17 CFR 244.100, General rules regarding disclosure of non-GAAP financial measures (Regulation G) — Current codified text of Regulation G rule 100: reconciliation requirement and the misleading-measure prohibition.
- 17 CFR 229.10, Item 10 of Regulation S-K, paragraph (e) — Use of non-GAAP financial measures in Commission filings, including the bar on smoothing items likely to recur within two years.

Disagree? Have a War Story?
I read every reply. If you've seen this pattern play out differently, or have a counter-example that breaks my argument, I want to hear it.
Send a Reply →